Welcome to AIFlowChart.io, the ultimate AI-powered tool for transforming data into compelling visual narratives. Whether you're a seasoned professional or just starting out, AIFlowChart.io is designed to simplify the process of creating flowcharts, graphs, and diagrams. Here's a quick overview of what AIFlowChart.io offers:
What is AIFlowChart.io?
AIFlowChart.io is an AI-driven platform that takes the complexity out of data visualization. Its primary purpose is to convert raw data into easy-to-understand diagrams, making it an invaluable asset for professionals across various industries. The tool's value proposition lies in its ability to automate the diagram creation process, saving you time and effort while ensuring accuracy and consistency.
How to use AIFlowChart.io?
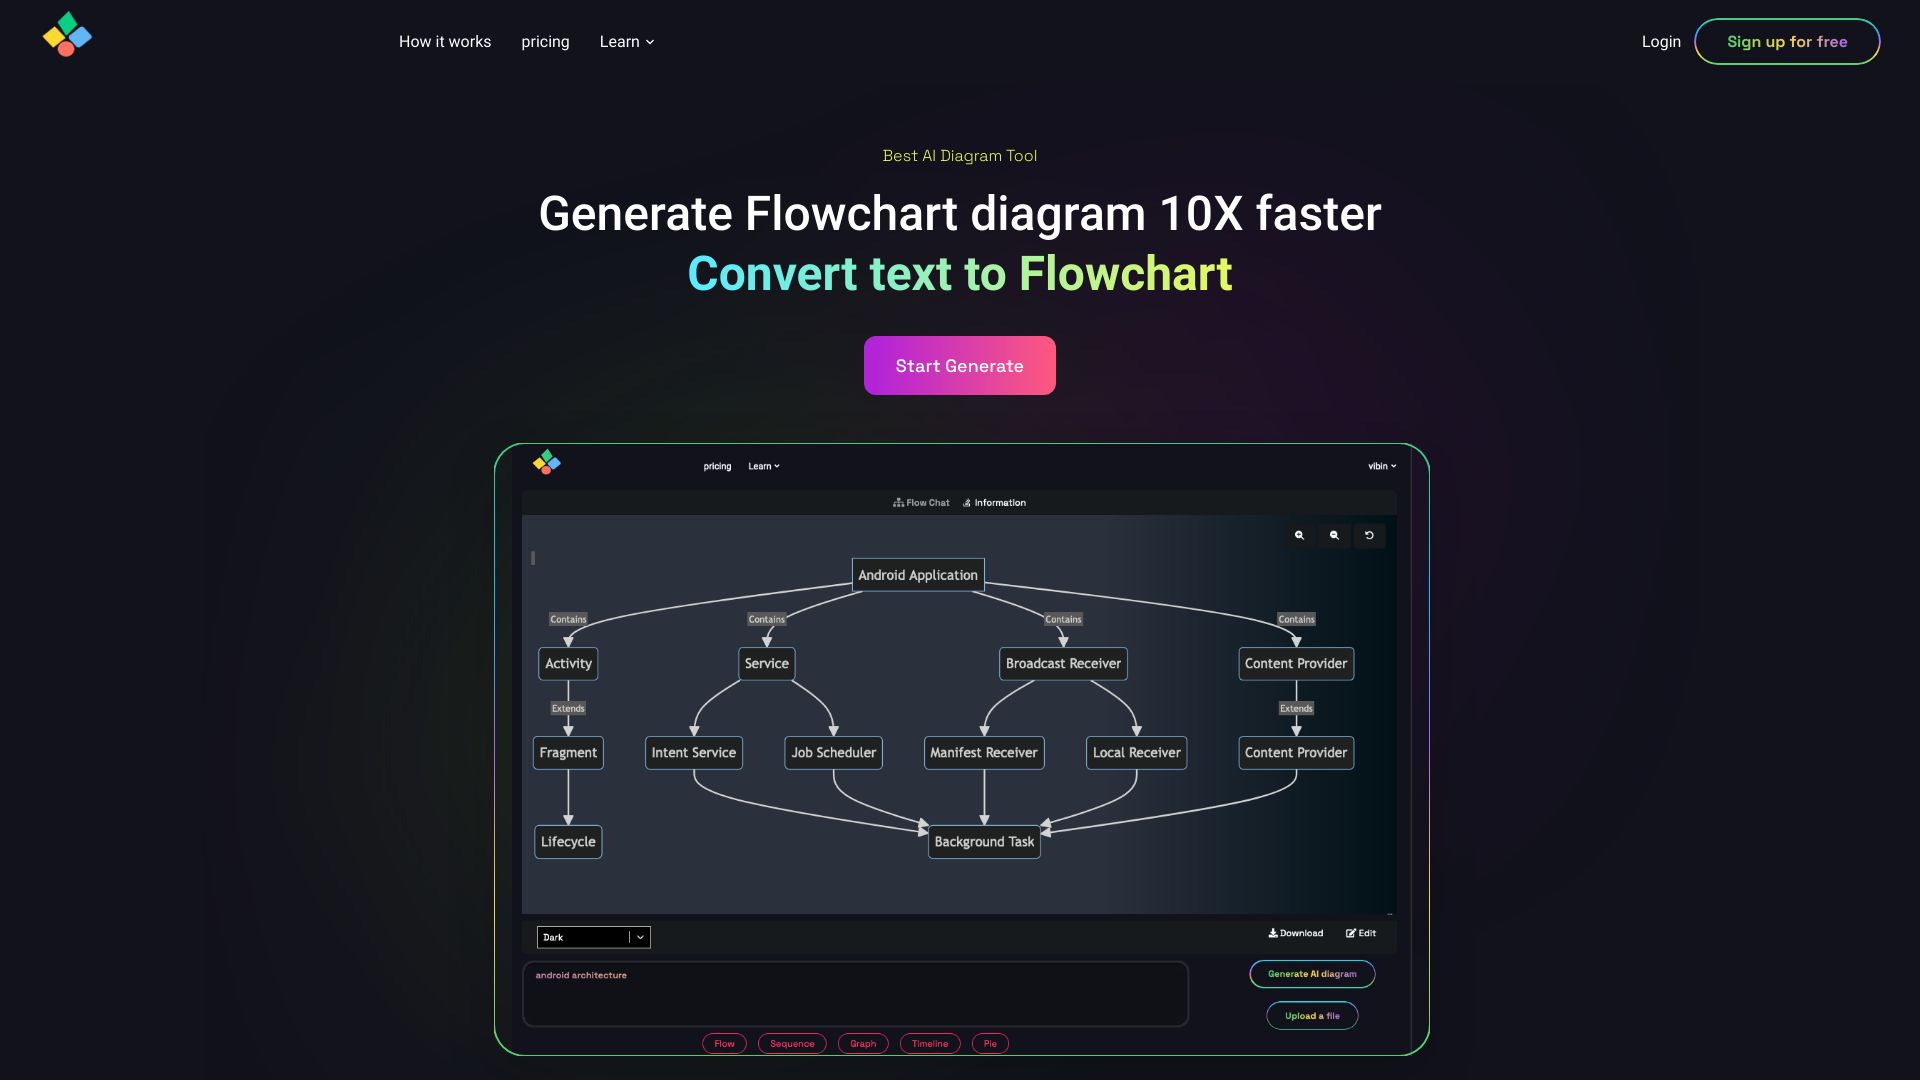
Using AIFlowChart.io is straightforward. Begin by importing your data from a variety of sources, including spreadsheets, databases, and APIs. The AI then analyzes the data and generates a diagram tailored to your needs. You can easily customize the diagram with various themes, colors, and layout options to suit your preferences. Once you're satisfied, export or share your diagram directly from the platform.
Core features of AIFlowChart.io?
AIFlowChart.io boasts several core features that set it apart from other diagramming tools:
- Automated Diagram Generation: Leverage AI to create diagrams from a wide range of data sources with minimal manual input.
- Customization Options: Personalize your diagrams with a variety of themes, colors, and layout options.
- Integration Capabilities: Seamlessly integrate with popular data formats and platforms for a streamlined workflow.
- User-Friendly Interface: Enjoy an intuitive design that makes it easy to create and share diagrams.
Ready to elevate your data visualization game? Try AIFlowChart.io today and see how it can transform your data into compelling visuals.

