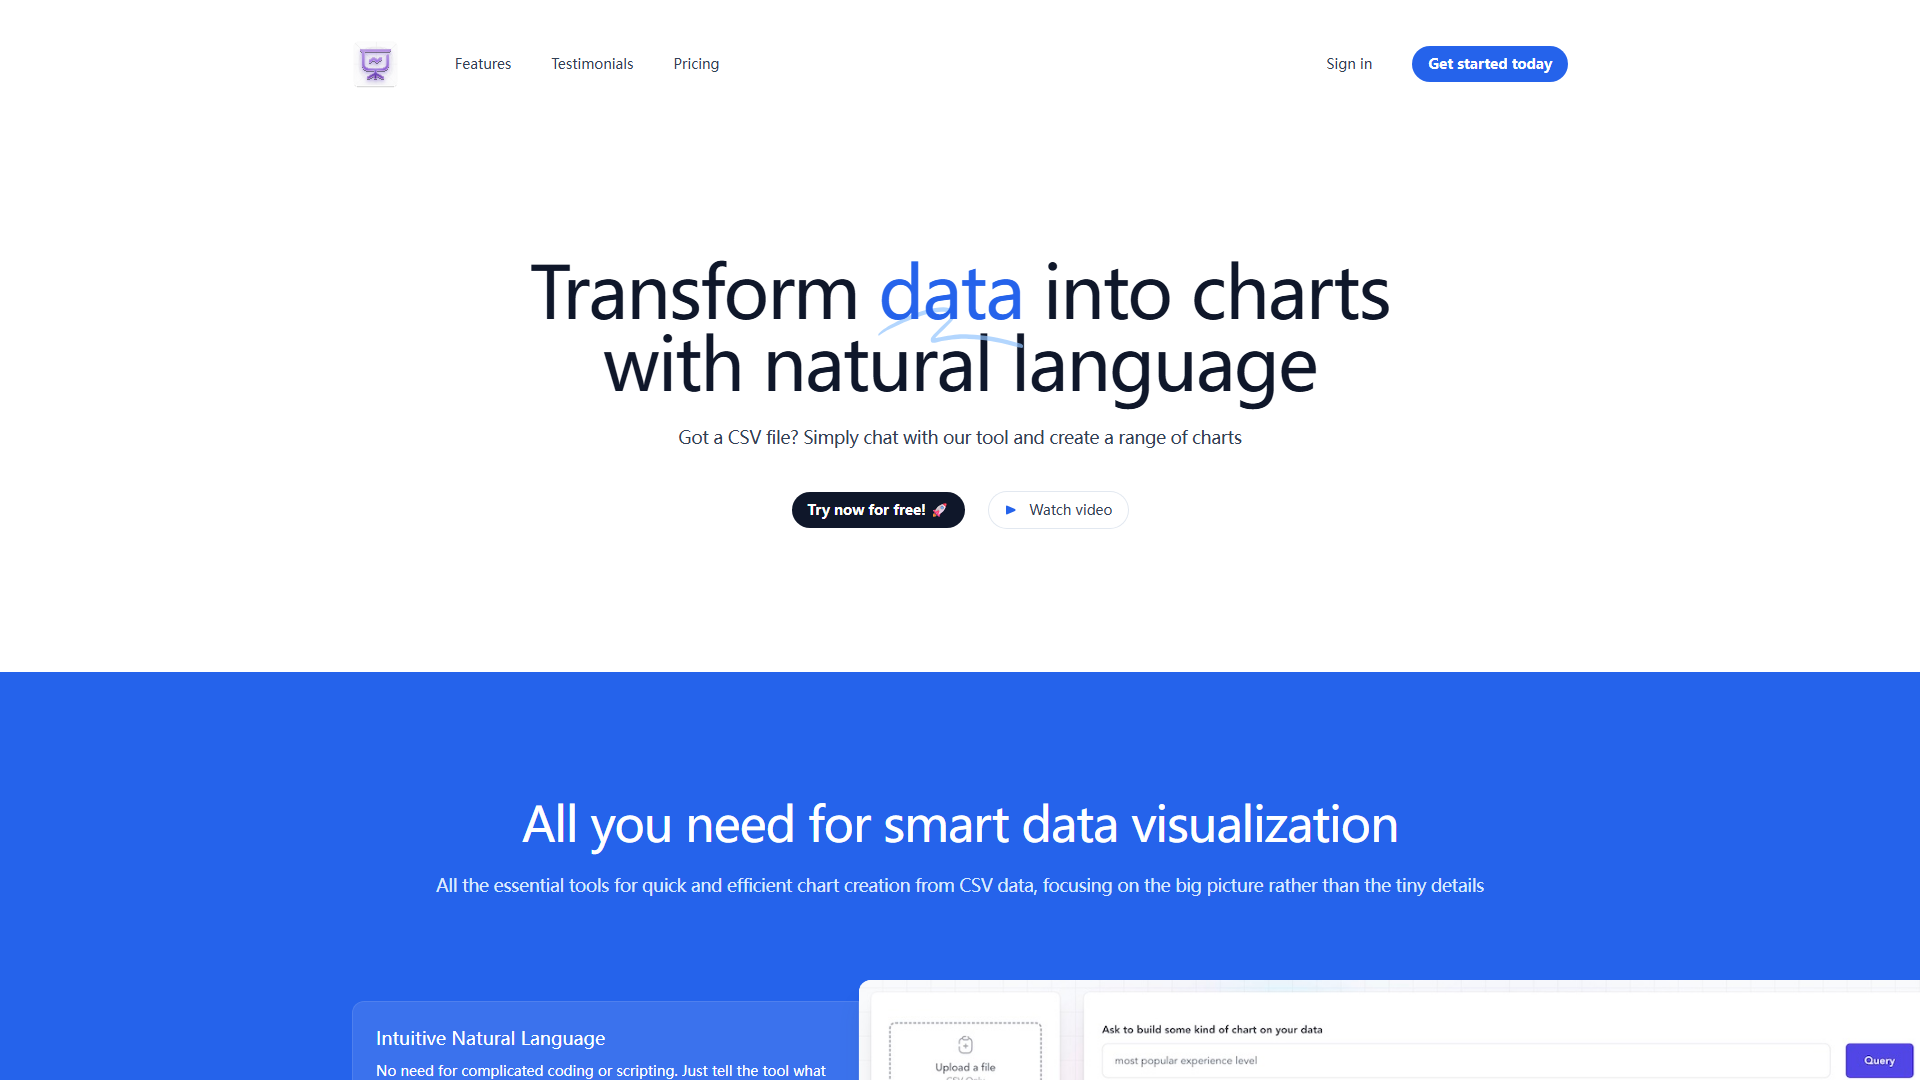
Discover the power of Chat2CSV, the transformative tool that revolutionizes data visualization. What is Chat2CSV? It's a user-friendly platform designed to convert your CSV data into interactive charts, empowering you to interpret complex information with ease. Learn how to use Chat2CSV by following a simple workflow that streamlines the data-to-insight process. Explore the core features, including intuitive data input, advanced chart customization, and seamless data sharing, all designed to enhance your data analysis capabilities. Whether you're a data scientist or a business leader, Chat2CSV is your gateway to visualizing data effectively. Start transforming your data today and unlock the potential of data-driven insights. Join the ranks of satisfied users who've harnessed the power of Chat2CSV to turn raw data into compelling visual narratives.

Chat2CSV
Data visualization platform transforming CSV data into charts using natural language processing.

Top Alternatives to Chat2CSV
ECharts Data Visualization
ECharts Data Visualization is a versatile and powerful charting library designed for web applications. Renowned for its ease of use and high level of customization, ECharts empowers developers to create engaging and informative data visualizations with minimal effort. Whether you're a data analyst, web designer, or developer, ECharts provides a comprehensive suite of chart types, including line, bar, pie, and scatter charts, to effectively convey your data stories. Its responsive design ensures that visualizations look stunning across all devices, and its modular architecture allows for seamless integration into any web project. With ECharts, you can transform raw data into compelling visual representations, enhancing user engagement and insights. ###
ChatViz
ChatViz is a powerful developer tool designed to transform complex data into intuitive visual representations using the capabilities of ChatGPT. This innovative platform empowers developers to effortlessly visualize their data, making it easier to analyze trends, identify patterns, and make informed decisions. With its seamless integration with ChatGPT, ChatViz simplifies the process of data visualization, offering a user-friendly interface and advanced features. Whether you're working on a data-driven project or enhancing your application's user experience, ChatViz provides a comprehensive solution for all your data visualization needs.
VMind
VMind is an innovative AI-powered visualization tool designed to transform complex data into intuitive and engaging visual representations. This cutting-edge software leverages advanced algorithms to offer users a seamless experience in data analysis and presentation. Key features include automated data visualization, real-time updates, and integration with various data sources. Ideal for businesses, researchers, and educators, VMind streamlines the process of understanding and communicating data insights. Its user-friendly interface and robust functionalities make it a versatile tool for data-driven decision-making, market analysis, and educational purposes.
Bots
Introducing Bots, the ultimate application for crafting personalized chatbots and generating insightful charts with cutting-edge AI models. Bots empowers users to create custom chatbots that seamlessly integrate into their platforms, enhancing customer interactions and engagement. With its intuitive interface and robust AI capabilities, Bots enables businesses to automate customer service, gather valuable insights, and streamline operations. Whether you're a small business owner or a seasoned developer, Bots is your go-to tool for building intelligent, interactive chatbots that drive results.
GPT Diagrams Generator
Introducing GPT Diagrams Generator, the ultimate tool for transforming your text prompts into stunning chart images with ease. Whether you're a data analyst, project manager, or simply need to visualize complex ideas, GPT Diagrams Generator is your go-to solution. This innovative tool leverages advanced AI technology to convert your text descriptions into clear, visually engaging diagrams, saving you time and effort. With a user-friendly interface and a wide range of chart types, GPT Diagrams Generator is perfect for creating flowcharts, infographics, and more. Its intuitive design and powerful features make it an essential asset for anyone looking to communicate information effectively.
Athenic AI
Athenic AI is a revolutionary data empowerment tool designed to transform raw data into insightful graphs and dashboards. By harnessing the power of AI, it simplifies the process of data analysis, enabling users to quickly visualize complex information. Whether you're a business professional, data analyst, or researcher, Athenic AI streamlines the creation of data-driven insights. Its intuitive interface and advanced algorithms make it easy to build interactive visualizations that reveal trends, patterns, and correlations. Use Athenic AI to enhance decision-making, optimize business strategies, and present data more effectively in presentations and reports. ###
ChartPixel
ChartPixel is an innovative AI-driven data analysis and visualization platform designed to deliver instant insights like never before. This powerful tool empowers users to transform complex data into intuitive, actionable visual representations. With its user-friendly interface and advanced AI capabilities, ChartPixel is ideal for businesses and professionals seeking to gain a competitive edge through data-driven decision-making. Key features include automated data analysis, real-time visualization, and customizable dashboards. Whether you're a data analyst, market researcher, or business strategist, ChartPixel simplifies the process of understanding and presenting data, making it the go-to solution for anyone who wants to make informed decisions quickly and effectively.
Supaboard
Supaboard is an innovative AI-powered Business Intelligence tool designed for users seeking to create and analyze dashboards without any technical expertise. This intuitive platform empowers individuals and teams to visualize and interpret complex data with ease, making it an ideal solution for businesses of all sizes. With Supaboard, users can build interactive dashboards, track key performance indicators, and gain actionable insights from their data. Key features include drag-and-drop interface, real-time data updates, seamless integration with various data sources, and customizable visualizations. Supaboard is perfect for sales, marketing, finance, and operations teams looking to streamline their data analysis and decision-making processes.
GPT Spreadsheets Visualization
Introducing GPT Spreadsheets Visualization, the ultimate tool for transforming complex data into stunning visual representations. This innovative AI-driven platform leverages Large Language Models (LLMs) and code to generate high-quality data visualizations and infographics. With GPT Spreadsheets Visualization, users can effortlessly create engaging and informative visual content for presentations, reports, and websites. Key features include automatic data analysis, customizable design options, and seamless integration with popular spreadsheet software. Whether you're a data analyst, business professional, or content creator, GPT Spreadsheets Visualization is your go-to solution for making data-driven decisions and captivating your audience with compelling visuals. ###
DataBrain
DataBrain is a powerful embedded analytics platform designed for self-service business intelligence (BI) and customer-facing analytics. This user-friendly tool empowers businesses to gain actionable insights from their data with ease. With its intuitive interface and robust features, DataBrain allows users to create custom dashboards, visualize complex data sets, and share insights with stakeholders. Key benefits include simplified data analysis, improved decision-making, and enhanced customer engagement. Whether you're a small business owner or a data analyst, DataBrain is the ideal solution for streamlining your analytics processes and driving business growth. ###
Power BI
Power BI is a powerful data analytics tool that leverages Generative AI to revolutionize real-time data interaction. It empowers users to seamlessly query and generate interactive charts from vast datasets, making complex information accessible and actionable. With its intuitive interface and robust features, Power BI is an ideal choice for businesses seeking to visualize their data and make informed decisions. Its real-time capabilities enable users to stay ahead of the curve, uncovering insights that drive business growth. From sales and marketing analytics to operational efficiency, Power BI's versatile applications cater to a wide range of use cases, making it a must-have tool for data-driven organizations. ###
Market Genius AI
Market Genius AI is a revolutionary AI-powered platform designed to transform earnings call transcripts into comprehensive, interactive dashboards. This innovative tool empowers investors and financial analysts with actionable insights, making it easier to understand and capitalize on market trends. By leveraging advanced natural language processing and machine learning algorithms, Market Genius AI distills complex financial data into digestible, visually engaging dashboards. Key features include real-time sentiment analysis, key metric tracking, and customizable alert systems. Whether you're a seasoned investor or just starting out, Market Genius AI is your go-to resource for uncovering hidden opportunities and staying ahead of the market curve. ###
Julius AI
Introducing Julius AI, the ultimate AI-powered data analyst tool designed for professionals seeking precise and insightful data analysis and visualization. With Julius AI, you can transform raw data into actionable insights with ease. The tool's intuitive interface and advanced algorithms make it an ideal choice for businesses, researchers, and data enthusiasts alike. Key features include automated data processing, real-time visualization, and customizable reports. Julius AI is perfect for a variety of use cases, such as market analysis, financial forecasting, and performance tracking. Elevate your data analysis game with Julius AI – where data meets clarity. ###
Vizzy
Vizzy is an innovative, open-source data visualization tool designed to streamline the creation of compelling visual representations of data. Leveraging the power of ChatGPT, Vizzy empowers users to rapidly transform raw data into engaging charts and graphs. Its intuitive interface and seamless integration with various data sources make it an ideal choice for data analysts, business professionals, and anyone looking to communicate data-driven insights effectively. With Vizzy, you can easily create professional-looking visualizations to support presentations, reports, and strategic decision-making. Key features include real-time data updates, customizable templates, and advanced charting options. Whether you're visualizing sales trends, market research, or customer behavior, Vizzy simplifies the process and enhances the clarity of your data storytelling. ###
AIFlowChart.io
AIFlowChart.io is an innovative AI-powered tool designed to streamline the creation of flowcharts, graphs, and diagrams with unparalleled ease. This versatile platform leverages advanced machine learning algorithms to transform complex data into visually engaging and informative visual representations. Whether you're a project manager, data analyst, or simply someone in need of a clear visual aid, AIFlowChart.io is your go-to solution. With its intuitive interface and robust features, users can effortlessly generate high-quality diagrams from various data sources, saving time and enhancing communication. Key benefits include automated diagram generation, customization options, and seamless integration with popular data formats. Use AIFlowChart.io to visualize your data, improve decision-making, and present your ideas more effectively. ###
Dateno
Dateno is an innovative AI-powered data analysis platform designed for businesses and professionals seeking rapid insights and compelling visualizations without the need for technical coding skills. This powerful tool empowers users to uncover valuable data trends and make informed decisions with ease. With Dateno, you can efficiently analyze large datasets, visualize complex information, and share your findings with a simple drag-and-drop interface. Ideal for marketing analysts, financial professionals, and anyone requiring fast, accurate data interpretations, Dateno streamlines the data analysis process, enhancing productivity and insight generation. ###
ChartAI
ChartAI is a revolutionary AI-driven tool designed to streamline the creation of professional diagrams and charts in mere seconds. This innovative platform harnesses the power of artificial intelligence to generate high-quality visuals with precision and efficiency. Ideal for professionals, students, and anyone in need of quick, visually appealing data representation, ChartAI offers a range of customizable templates and advanced editing features. Whether you're creating presentations, reports, or infographics, ChartAI empowers you to communicate complex information with clarity and impact. Experience the ease of turning raw data into compelling visuals that resonate with your audience. ###
vizGPT
Discover vizGPT, the revolutionary AI tool designed to transform your data into stunning visualizations with just a few words. This intuitive platform allows users to effortlessly generate compelling charts, graphs, and infographics from natural language queries and datasets. Whether you're a data analyst, business professional, or academic researcher, vizGPT streamlines the process of data visualization, saving time and enhancing the clarity of your insights. With its user-friendly interface and advanced AI algorithms, vizGPT is the perfect tool for anyone looking to communicate complex information in a visually engaging and accessible manner. ###
ChartFast
ChartFast is an innovative AI-powered data analyst tool designed to revolutionize the way professionals visualize and analyze data. This user-friendly platform offers streamlined data visualization, making it an essential tool for businesses and individuals seeking to gain actionable insights from their data. With its advanced algorithms and intuitive interface, ChartFast enables users to create compelling charts and reports in minutes, saving valuable time and resources. Key features include automatic data recognition, customizable chart templates, and real-time collaboration, making it ideal for a wide range of use cases, from business analytics to academic research. Whether you're a data analyst, a marketing professional, or a student, ChartFast empowers you to make informed decisions with confidence. ###