
What is ChatViz?
ChatViz is a powerful developer tool transforming complex data into intuitive visual representations using ChatGPT. It empowers developers to visualize data, analyze trends, identify patterns, and make informed decisions through seamless ChatGPT integration.
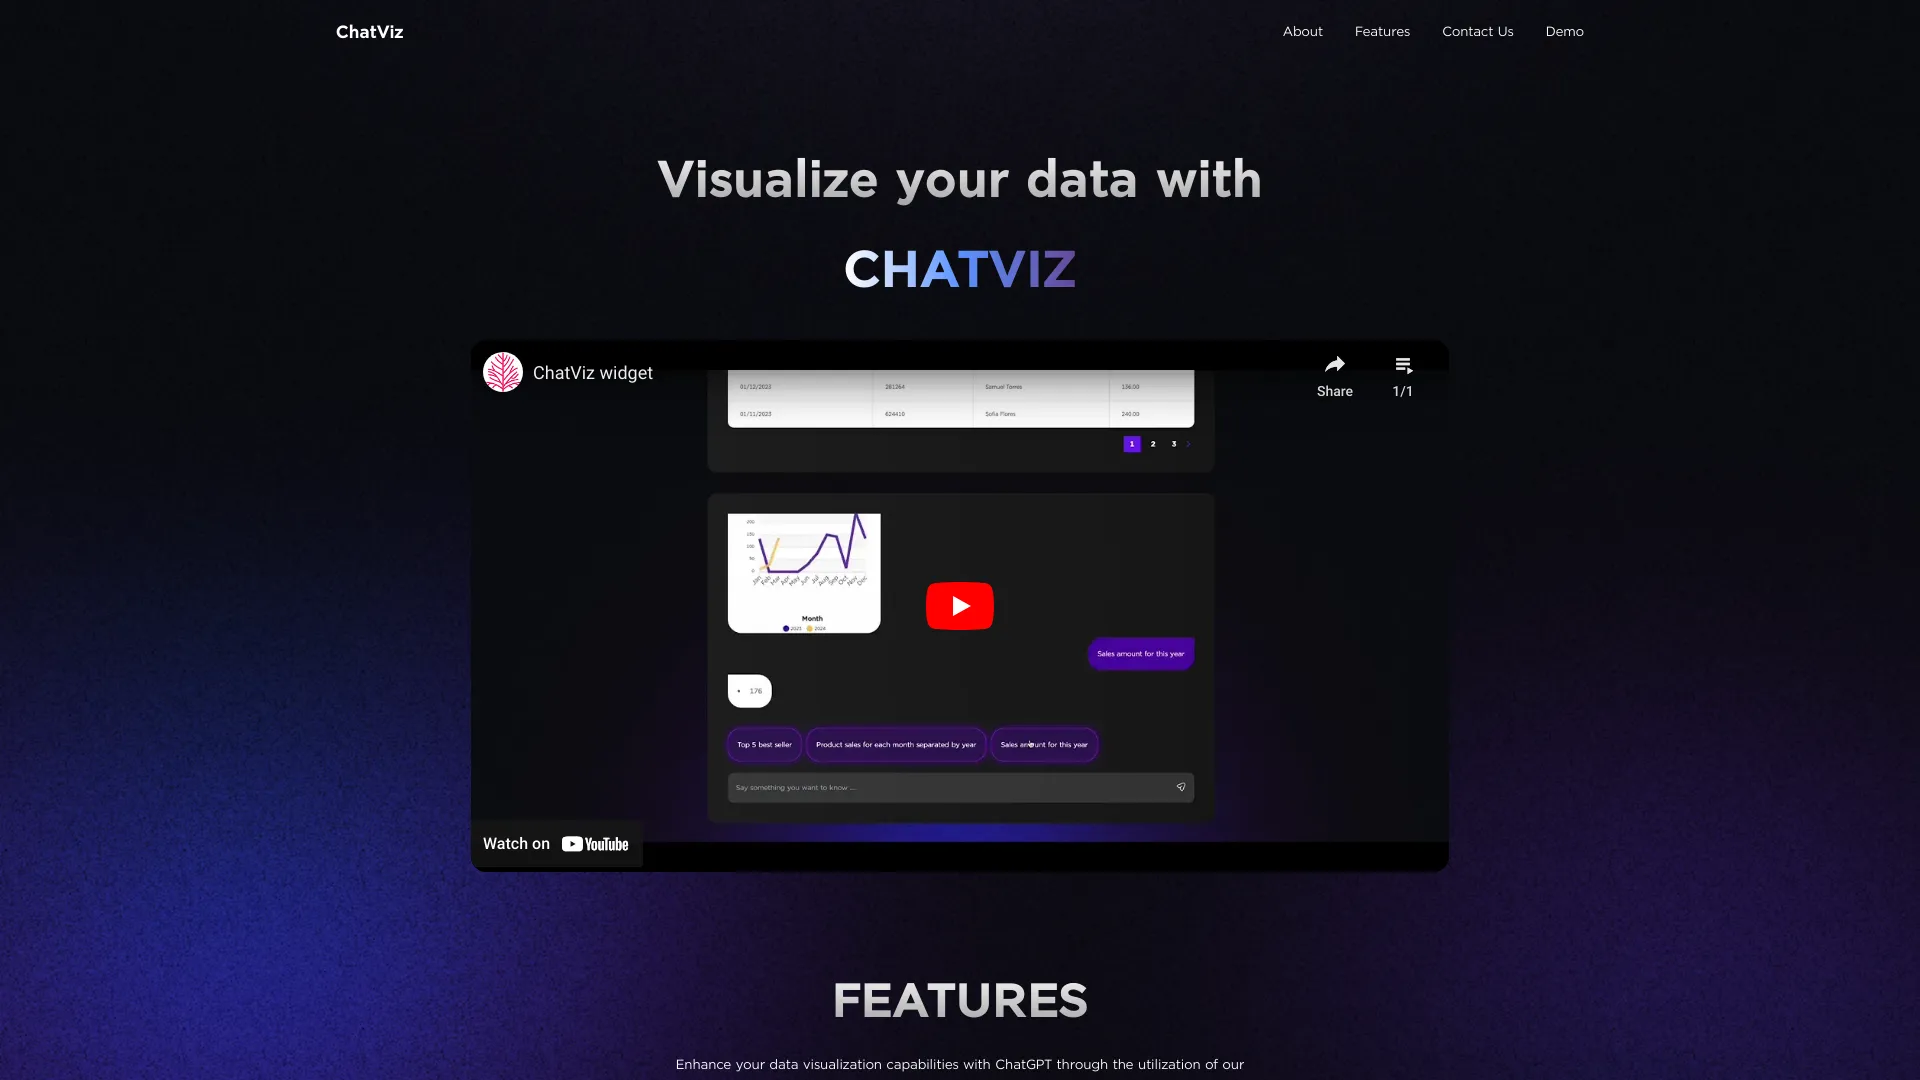
How to use ChatViz?
Upload your data through the intuitive interface, and ChatViz automatically generates visual charts and graphs. Customize these visualizations to match your requirements, then share with colleagues or embed directly into your applications.
Core features of ChatViz?
- Automatic Data Visualization: Convert raw data into various chart formats instantly.
- Advanced Customization: Tailor visualizations with colors, labels, and interactive elements.
- ChatGPT Integration: Leverage AI-powered analysis and insights for deeper understanding.
- Seamless Export Options: Download visualizations in multiple formats or embed them into projects.