GPT Diagrams Generator

GPT Diagrams Generator

A tool to convert text prompts into chart images for easy visualization.

GPT Diagrams Generator

Welcome to the future of data visualization with GPT Diagrams Generator! This revolutionary tool is designed to simplify the process of converting your text-based ideas into compelling chart images. At its core, GPT Diagrams Generator is an AI-driven platform that empowers users to create professional-looking diagrams with just a few clicks. Here's how it works:

  1. What is GPT Diagrams Generator? GPT Diagrams Generator is a state-of-the-art tool that transforms your written text into high-quality chart images. Its primary purpose is to streamline the visualization of information, making it easier to understand and communicate complex concepts. The tool's value proposition lies in its ability to save time and enhance the clarity of your data representation.

  2. How to use GPT Diagrams Generator? Using GPT Diagrams Generator is straightforward. Begin by entering your text prompt into the generator's interface. Choose from a variety of chart types, including flowcharts, timelines, and infographics. The tool then processes your input and presents you with a visually appealing diagram that you can easily edit and share.

  3. Core features of GPT Diagrams Generator?
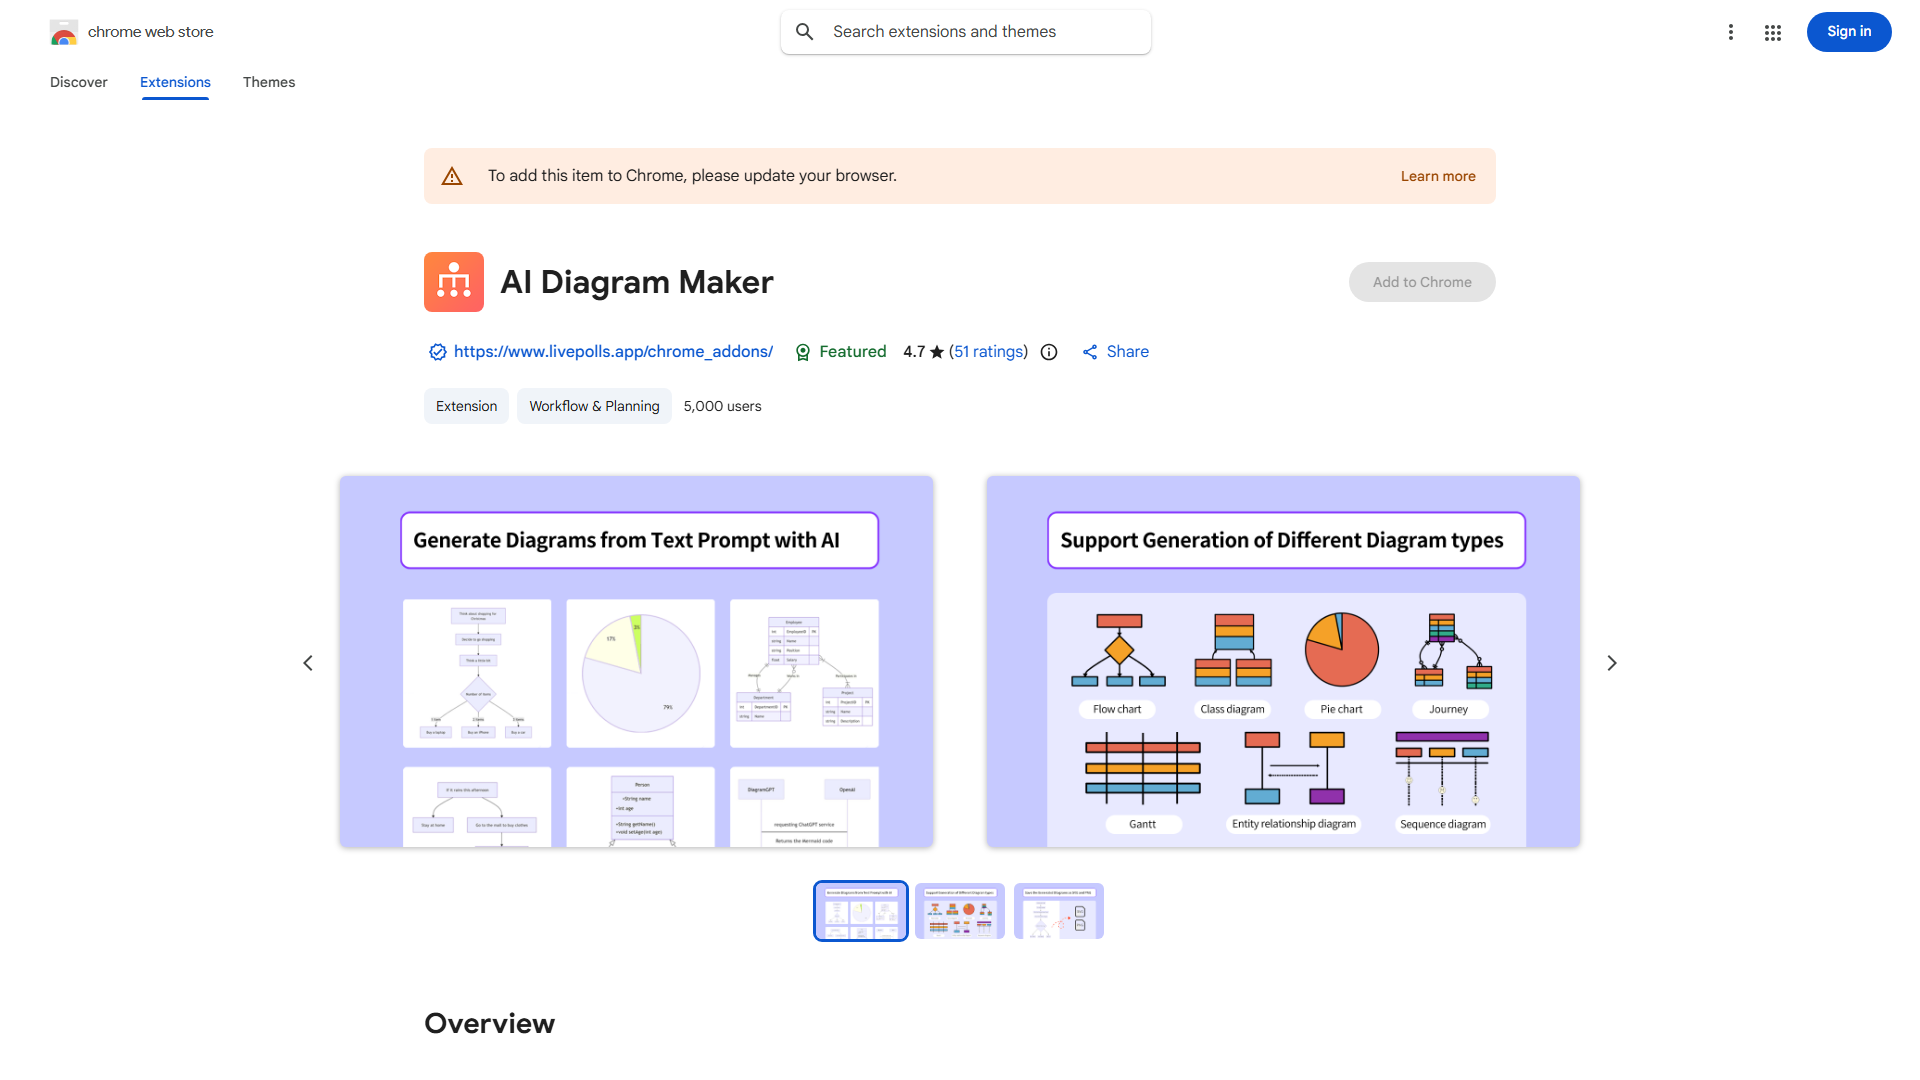
 GPT Diagrams Generator boasts several key features that set it apart from other visualization tools. These include:

    • A wide range of chart types to suit different needs.
    • AI-driven accuracy and efficiency in diagram creation.
    • Intuitive editing tools for customizing your diagrams.
    • Easy export options for sharing and integration with other platforms.

Are you ready to take your data visualization to the next level? Try GPT Diagrams Generator today and experience the power of AI-powered diagram creation!

Top Alternatives to GPT Diagrams Generator

ECharts Data Visualization

ECharts Data Visualization

ECharts Data Visualization is a versatile and powerful charting library designed for web applications. Renowned for its ease of use and high level of customization, ECharts empowers developers to create engaging and informative data visualizations with minimal effort. Whether you're a data analyst, web designer, or developer, ECharts provides a comprehensive suite of chart types, including line, bar, pie, and scatter charts, to effectively convey your data stories. Its responsive design ensures that visualizations look stunning across all devices, and its modular architecture allows for seamless integration into any web project. With ECharts, you can transform raw data into compelling visual representations, enhancing user engagement and insights. ###

ChatViz

ChatViz

ChatViz is a powerful developer tool designed to transform complex data into intuitive visual representations using the capabilities of ChatGPT. This innovative platform empowers developers to effortlessly visualize their data, making it easier to analyze trends, identify patterns, and make informed decisions. With its seamless integration with ChatGPT, ChatViz simplifies the process of data visualization, offering a user-friendly interface and advanced features. Whether you're working on a data-driven project or enhancing your application's user experience, ChatViz provides a comprehensive solution for all your data visualization needs.

VMind

VMind

VMind is an innovative AI-powered visualization tool designed to transform complex data into intuitive and engaging visual representations. This cutting-edge software leverages advanced algorithms to offer users a seamless experience in data analysis and presentation. Key features include automated data visualization, real-time updates, and integration with various data sources. Ideal for businesses, researchers, and educators, VMind streamlines the process of understanding and communicating data insights. Its user-friendly interface and robust functionalities make it a versatile tool for data-driven decision-making, market analysis, and educational purposes.

Chat2CSV

Chat2CSV

Elevate your data visualization game with Chat2CSV, the innovative platform that turns complex CSV data into intuitive charts using natural language processing. Say goodbye to the complexities of data analysis and hello to visual insights at your fingertips. Chat2CSV is perfect for data enthusiasts, business analysts, and anyone looking to transform raw data into compelling visual narratives. With its intuitive interface and powerful features, you can effortlessly convert your data into dynamic charts, graphs, and maps, making it easier to spot trends, make data-driven decisions, and communicate your findings effectively. Whether you're a seasoned pro or a data novice, Chat2CSV is your go-to tool for data visualization made simple.

Bots

Bots

Introducing Bots, the ultimate application for crafting personalized chatbots and generating insightful charts with cutting-edge AI models. Bots empowers users to create custom chatbots that seamlessly integrate into their platforms, enhancing customer interactions and engagement. With its intuitive interface and robust AI capabilities, Bots enables businesses to automate customer service, gather valuable insights, and streamline operations. Whether you're a small business owner or a seasoned developer, Bots is your go-to tool for building intelligent, interactive chatbots that drive results.

Athenic AI

Athenic AI

Athenic AI is a revolutionary data empowerment tool designed to transform raw data into insightful graphs and dashboards. By harnessing the power of AI, it simplifies the process of data analysis, enabling users to quickly visualize complex information. Whether you're a business professional, data analyst, or researcher, Athenic AI streamlines the creation of data-driven insights. Its intuitive interface and advanced algorithms make it easy to build interactive visualizations that reveal trends, patterns, and correlations. Use Athenic AI to enhance decision-making, optimize business strategies, and present data more effectively in presentations and reports. ###

ChartPixel

ChartPixel

ChartPixel is an innovative AI-driven data analysis and visualization platform designed to deliver instant insights like never before. This powerful tool empowers users to transform complex data into intuitive, actionable visual representations. With its user-friendly interface and advanced AI capabilities, ChartPixel is ideal for businesses and professionals seeking to gain a competitive edge through data-driven decision-making. Key features include automated data analysis, real-time visualization, and customizable dashboards. Whether you're a data analyst, market researcher, or business strategist, ChartPixel simplifies the process of understanding and presenting data, making it the go-to solution for anyone who wants to make informed decisions quickly and effectively.

Supaboard

Supaboard

Supaboard is an innovative AI-powered Business Intelligence tool designed for users seeking to create and analyze dashboards without any technical expertise. This intuitive platform empowers individuals and teams to visualize and interpret complex data with ease, making it an ideal solution for businesses of all sizes. With Supaboard, users can build interactive dashboards, track key performance indicators, and gain actionable insights from their data. Key features include drag-and-drop interface, real-time data updates, seamless integration with various data sources, and customizable visualizations. Supaboard is perfect for sales, marketing, finance, and operations teams looking to streamline their data analysis and decision-making processes.

GPT Spreadsheets Visualization

GPT Spreadsheets Visualization

Introducing GPT Spreadsheets Visualization, the ultimate tool for transforming complex data into stunning visual representations. This innovative AI-driven platform leverages Large Language Models (LLMs) and code to generate high-quality data visualizations and infographics. With GPT Spreadsheets Visualization, users can effortlessly create engaging and informative visual content for presentations, reports, and websites. Key features include automatic data analysis, customizable design options, and seamless integration with popular spreadsheet software. Whether you're a data analyst, business professional, or content creator, GPT Spreadsheets Visualization is your go-to solution for making data-driven decisions and captivating your audience with compelling visuals. ###

DataBrain

DataBrain

DataBrain is a powerful embedded analytics platform designed for self-service business intelligence (BI) and customer-facing analytics. This user-friendly tool empowers businesses to gain actionable insights from their data with ease. With its intuitive interface and robust features, DataBrain allows users to create custom dashboards, visualize complex data sets, and share insights with stakeholders. Key benefits include simplified data analysis, improved decision-making, and enhanced customer engagement. Whether you're a small business owner or a data analyst, DataBrain is the ideal solution for streamlining your analytics processes and driving business growth. ###

Power BI

Power BI

Power BI is a powerful data analytics tool that leverages Generative AI to revolutionize real-time data interaction. It empowers users to seamlessly query and generate interactive charts from vast datasets, making complex information accessible and actionable. With its intuitive interface and robust features, Power BI is an ideal choice for businesses seeking to visualize their data and make informed decisions. Its real-time capabilities enable users to stay ahead of the curve, uncovering insights that drive business growth. From sales and marketing analytics to operational efficiency, Power BI's versatile applications cater to a wide range of use cases, making it a must-have tool for data-driven organizations. ###

Market Genius AI

Market Genius AI

Market Genius AI is a revolutionary AI-powered platform designed to transform earnings call transcripts into comprehensive, interactive dashboards. This innovative tool empowers investors and financial analysts with actionable insights, making it easier to understand and capitalize on market trends. By leveraging advanced natural language processing and machine learning algorithms, Market Genius AI distills complex financial data into digestible, visually engaging dashboards. Key features include real-time sentiment analysis, key metric tracking, and customizable alert systems. Whether you're a seasoned investor or just starting out, Market Genius AI is your go-to resource for uncovering hidden opportunities and staying ahead of the market curve. ###

Julius AI

Julius AI

Introducing Julius AI, the ultimate AI-powered data analyst tool designed for professionals seeking precise and insightful data analysis and visualization. With Julius AI, you can transform raw data into actionable insights with ease. The tool's intuitive interface and advanced algorithms make it an ideal choice for businesses, researchers, and data enthusiasts alike. Key features include automated data processing, real-time visualization, and customizable reports. Julius AI is perfect for a variety of use cases, such as market analysis, financial forecasting, and performance tracking. Elevate your data analysis game with Julius AI – where data meets clarity. ###

Vizzy

Vizzy

Vizzy is an innovative, open-source data visualization tool designed to streamline the creation of compelling visual representations of data. Leveraging the power of ChatGPT, Vizzy empowers users to rapidly transform raw data into engaging charts and graphs. Its intuitive interface and seamless integration with various data sources make it an ideal choice for data analysts, business professionals, and anyone looking to communicate data-driven insights effectively. With Vizzy, you can easily create professional-looking visualizations to support presentations, reports, and strategic decision-making. Key features include real-time data updates, customizable templates, and advanced charting options. Whether you're visualizing sales trends, market research, or customer behavior, Vizzy simplifies the process and enhances the clarity of your data storytelling. ###

AIFlowChart.io

AIFlowChart.io

AIFlowChart.io is an innovative AI-powered tool designed to streamline the creation of flowcharts, graphs, and diagrams with unparalleled ease. This versatile platform leverages advanced machine learning algorithms to transform complex data into visually engaging and informative visual representations. Whether you're a project manager, data analyst, or simply someone in need of a clear visual aid, AIFlowChart.io is your go-to solution. With its intuitive interface and robust features, users can effortlessly generate high-quality diagrams from various data sources, saving time and enhancing communication. Key benefits include automated diagram generation, customization options, and seamless integration with popular data formats. Use AIFlowChart.io to visualize your data, improve decision-making, and present your ideas more effectively. ###

Dateno

Dateno

Dateno is an innovative AI-powered data analysis platform designed for businesses and professionals seeking rapid insights and compelling visualizations without the need for technical coding skills. This powerful tool empowers users to uncover valuable data trends and make informed decisions with ease. With Dateno, you can efficiently analyze large datasets, visualize complex information, and share your findings with a simple drag-and-drop interface. Ideal for marketing analysts, financial professionals, and anyone requiring fast, accurate data interpretations, Dateno streamlines the data analysis process, enhancing productivity and insight generation. ###

ChartAI

ChartAI

ChartAI is a revolutionary AI-driven tool designed to streamline the creation of professional diagrams and charts in mere seconds. This innovative platform harnesses the power of artificial intelligence to generate high-quality visuals with precision and efficiency. Ideal for professionals, students, and anyone in need of quick, visually appealing data representation, ChartAI offers a range of customizable templates and advanced editing features. Whether you're creating presentations, reports, or infographics, ChartAI empowers you to communicate complex information with clarity and impact. Experience the ease of turning raw data into compelling visuals that resonate with your audience. ###

vizGPT

vizGPT

Discover vizGPT, the revolutionary AI tool designed to transform your data into stunning visualizations with just a few words. This intuitive platform allows users to effortlessly generate compelling charts, graphs, and infographics from natural language queries and datasets. Whether you're a data analyst, business professional, or academic researcher, vizGPT streamlines the process of data visualization, saving time and enhancing the clarity of your insights. With its user-friendly interface and advanced AI algorithms, vizGPT is the perfect tool for anyone looking to communicate complex information in a visually engaging and accessible manner. ###

ChartFast

ChartFast

ChartFast is an innovative AI-powered data analyst tool designed to revolutionize the way professionals visualize and analyze data. This user-friendly platform offers streamlined data visualization, making it an essential tool for businesses and individuals seeking to gain actionable insights from their data. With its advanced algorithms and intuitive interface, ChartFast enables users to create compelling charts and reports in minutes, saving valuable time and resources. Key features include automatic data recognition, customizable chart templates, and real-time collaboration, making it ideal for a wide range of use cases, from business analytics to academic research. Whether you're a data analyst, a marketing professional, or a student, ChartFast empowers you to make informed decisions with confidence. ###

Featured AI Tools

AIFlowChart.io

AIFlowChart.io

AIFlowChart.io is an innovative AI-powered tool designed to streamline the creation of flowcharts, graphs, and diagrams with unparalleled ease. This versatile platform leverages advanced machine learning algorithms to transform complex data into visually engaging and informative visual representations. Whether you're a project manager, data analyst, or simply someone in need of a clear visual aid, AIFlowChart.io is your go-to solution. With its intuitive interface and robust features, users can effortlessly generate high-quality diagrams from various data sources, saving time and enhancing communication. Key benefits include automated diagram generation, customization options, and seamless integration with popular data formats. Use AIFlowChart.io to visualize your data, improve decision-making, and present your ideas more effectively. ###

View Details
Vizzy

Vizzy

Vizzy is an innovative, open-source data visualization tool designed to streamline the creation of compelling visual representations of data. Leveraging the power of ChatGPT, Vizzy empowers users to rapidly transform raw data into engaging charts and graphs. Its intuitive interface and seamless integration with various data sources make it an ideal choice for data analysts, business professionals, and anyone looking to communicate data-driven insights effectively. With Vizzy, you can easily create professional-looking visualizations to support presentations, reports, and strategic decision-making. Key features include real-time data updates, customizable templates, and advanced charting options. Whether you're visualizing sales trends, market research, or customer behavior, Vizzy simplifies the process and enhances the clarity of your data storytelling. ###

View Details
Pitch

Pitch

Pitch is a powerful presentation software designed for dynamic teams, offering a seamless blend of design, collaboration, and analytics tools. Ideal for professionals seeking to create engaging and impactful presentations quickly, Pitch provides an intuitive interface that simplifies the process from concept to final presentation. With a focus on efficiency and team collaboration, Pitch empowers users to design visually stunning slides, share them effortlessly with colleagues, and gain valuable insights through its analytics features. Whether you're presenting a new business idea, showcasing a product, or delivering a training session, Pitch's comprehensive suite of features ensures your message is delivered effectively and memorably. ###

View Details

Cognify Insights

Cognify Insights is a groundbreaking browser extension designed to revolutionize the way users interact with data visualizations. This powerful tool leverages cutting-edge AI to provide in-depth analysis of diagrams, tables, and graphs. Whether you're a data analyst, researcher, or simply someone who needs to make sense of complex data, Cognify Insights is your ultimate companion. With its intuitive interface and advanced features, you can quickly uncover valuable insights, identify trends, and make informed decisions. Whether you're analyzing financial reports, market research, or scientific data, Cognify Insights streamlines your workflow and enhances your understanding of data visualizations like never before.

View Details
ChartFast

ChartFast

ChartFast is an innovative AI-powered data analyst tool designed to revolutionize the way professionals visualize and analyze data. This user-friendly platform offers streamlined data visualization, making it an essential tool for businesses and individuals seeking to gain actionable insights from their data. With its advanced algorithms and intuitive interface, ChartFast enables users to create compelling charts and reports in minutes, saving valuable time and resources. Key features include automatic data recognition, customizable chart templates, and real-time collaboration, making it ideal for a wide range of use cases, from business analytics to academic research. Whether you're a data analyst, a marketing professional, or a student, ChartFast empowers you to make informed decisions with confidence. ###

View Details
ECharts Data Visualization

ECharts Data Visualization

ECharts Data Visualization is a versatile and powerful charting library designed for web applications. Renowned for its ease of use and high level of customization, ECharts empowers developers to create engaging and informative data visualizations with minimal effort. Whether you're a data analyst, web designer, or developer, ECharts provides a comprehensive suite of chart types, including line, bar, pie, and scatter charts, to effectively convey your data stories. Its responsive design ensures that visualizations look stunning across all devices, and its modular architecture allows for seamless integration into any web project. With ECharts, you can transform raw data into compelling visual representations, enhancing user engagement and insights. ###

View Details
AI Graph Maker

AI Graph Maker

AI Graph Maker is a cutting-edge, AI-powered tool designed to transform complex data into stunning visualizations with unparalleled ease. This innovative platform empowers users to create professional-looking graphs, charts, and infographics in mere minutes, without any prior design experience. With its intuitive interface and advanced algorithms, AI Graph Maker simplifies the process of data representation, making it ideal for businesses, educators, and individuals seeking to communicate information effectively. Key features include automatic data analysis, a vast library of chart templates, and seamless integration with popular data sources. Whether you need to visualize sales trends, educational statistics, or research findings, AI Graph Maker is your go-to solution for producing compelling, data-driven visual content. ###

View Details
Julius AI

Julius AI

Introducing Julius AI, the ultimate AI-powered data analyst tool designed for professionals seeking precise and insightful data analysis and visualization. With Julius AI, you can transform raw data into actionable insights with ease. The tool's intuitive interface and advanced algorithms make it an ideal choice for businesses, researchers, and data enthusiasts alike. Key features include automated data processing, real-time visualization, and customizable reports. Julius AI is perfect for a variety of use cases, such as market analysis, financial forecasting, and performance tracking. Elevate your data analysis game with Julius AI – where data meets clarity. ###

View Details

D&AViz

D&AViz is a cutting-edge AI tool designed to transform raw data into compelling visual insights, empowering users to make informed decisions with ease. With its intuitive interface and robust analytics capabilities, D&AViz simplifies complex data interpretation, making it an invaluable asset for businesses, analysts, and researchers alike. Whether you're analyzing market trends, performance metrics, or any other data set, D&AViz provides a dynamic and interactive visualization platform that enhances understanding and accelerates decision-making processes. Key features include advanced data visualization techniques, real-time data updates, and customizable dashboards, making it an ideal solution for data-driven organizations looking to gain a competitive edge. ###

View Details

Xero.AI

Xero.AI is a cutting-edge, no-code analytics and machine learning platform designed to empower businesses with intuitive data insights. By harnessing the power of natural language, Xero.AI transforms complex data into actionable insights, making it accessible to users of all skill levels. This versatile tool is ideal for businesses seeking to streamline their data analysis process, with applications ranging from market research to customer segmentation. Key features include automated data analysis, natural language processing, and customizable dashboards. With Xero.AI, users can unlock the full potential of their data without the need for technical expertise, enabling them to make informed decisions and drive business growth.

View Details