
What is GPT Spreadsheets Visualization?
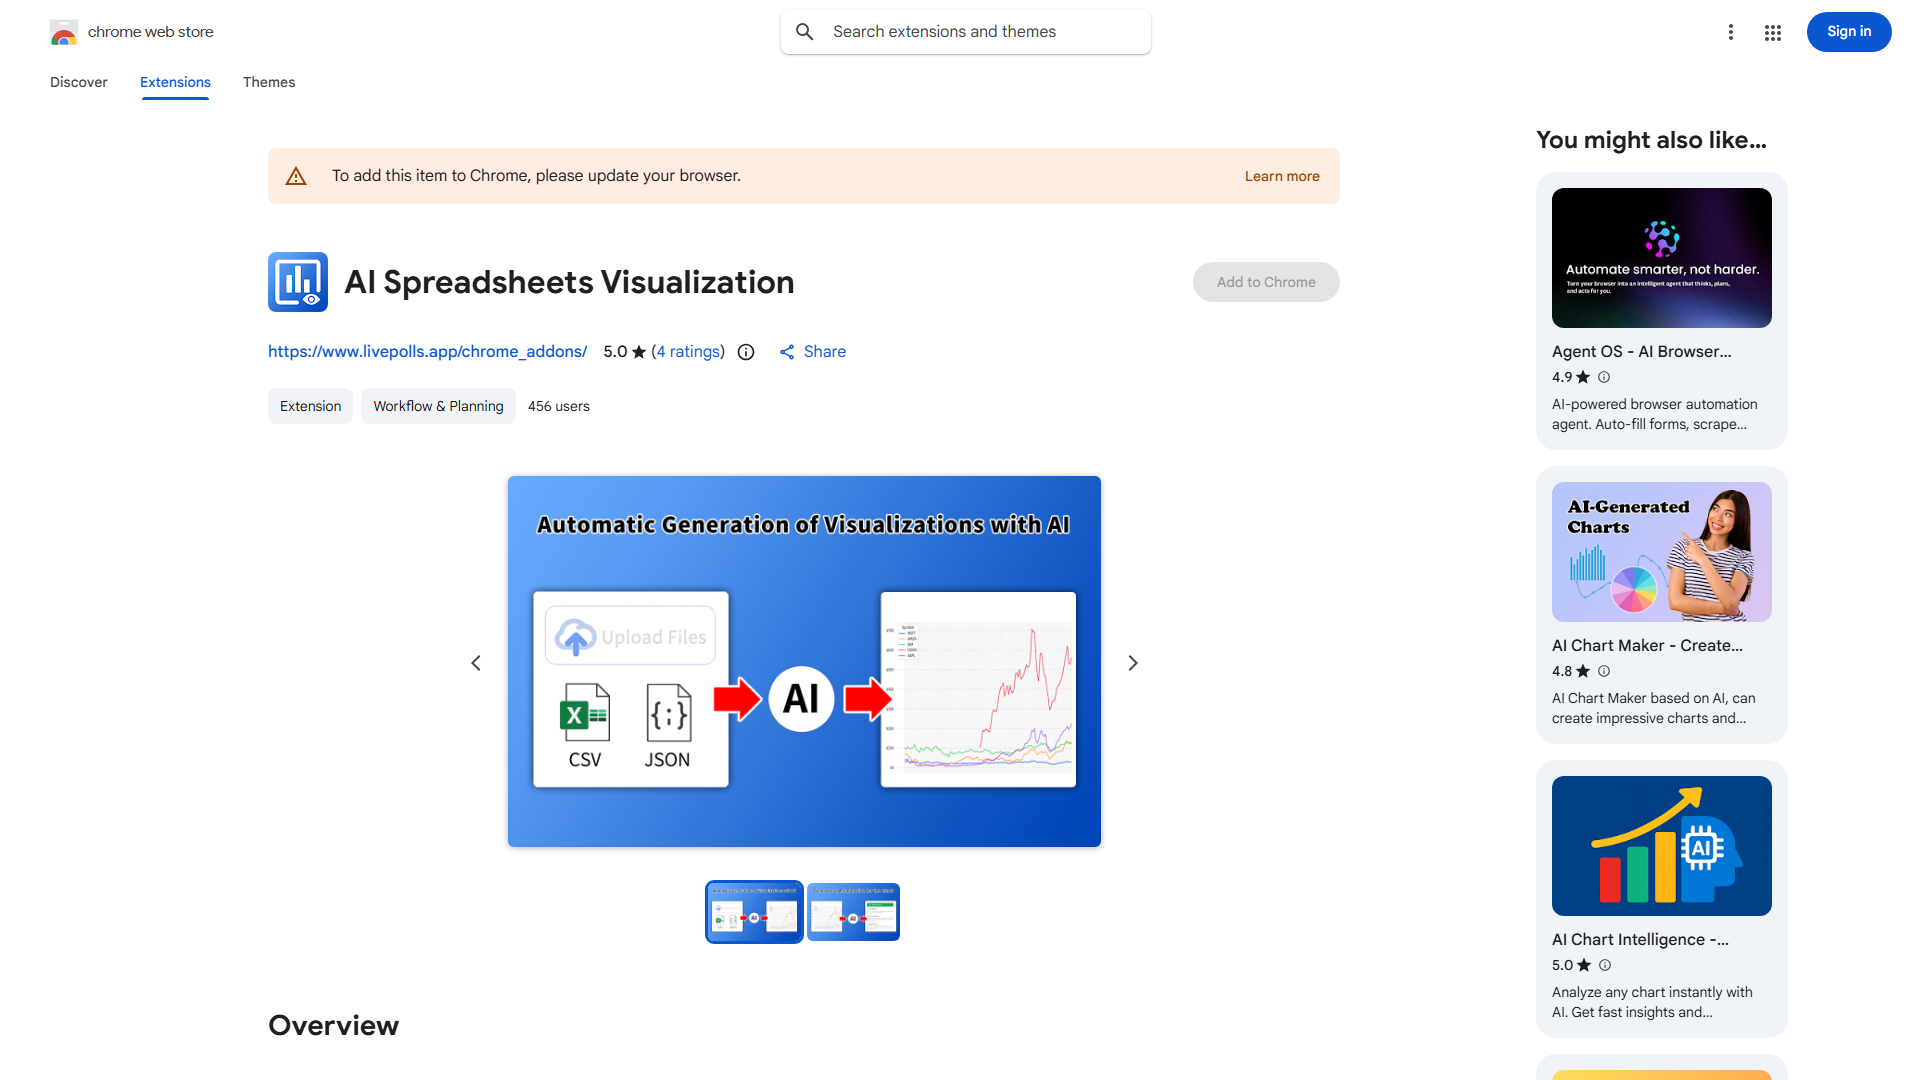
GPT Spreadsheets Visualization is an AI-powered platform that transforms complex data into stunning visual representations using Large Language Models and code. It creates engaging infographics for presentations, reports, and websites, making data accessible to all users.
How to use GPT Spreadsheets Visualization?
Import your data from any spreadsheet format. The AI automatically analyzes your information and suggests optimal visualization types. Customize colors, styles, and layouts to match your brand. Export your finished visualization directly to presentation software or share via link.
Core features of GPT Spreadsheets Visualization?
Advanced AI-driven data analysis ensures accurate insights. Extensive customization options allow brand-consistent designs. Seamless integration with popular spreadsheet software simplifies workflow. Multiple visualization types including charts, graphs, and infographics. Real-time collaboration features enable team-based projects.