
Spreadsite는 무엇인가요?
Spreadsite는 스프레드시트를 매력적이고 인터랙티브한 데이터 시각화로 변환하는 혁신적인 AI 기반 다이어그램 빌더입니다. 이 강력한 도구는 데이터 프레젠테이션 과정을 간소화하여 전문적인 다이어그램을 만들어 데이터로 이야기를 잘 전달하는 것을 더 이상 어렵지 않게 만듭니다. 직업 분석가, 데이터 과학자, 마케팅 전문가 여러분이 데이터를 정보적이고 시각적으로 매력적으로 시각화할 수 있도록 Spreadsite가 권장합니다.
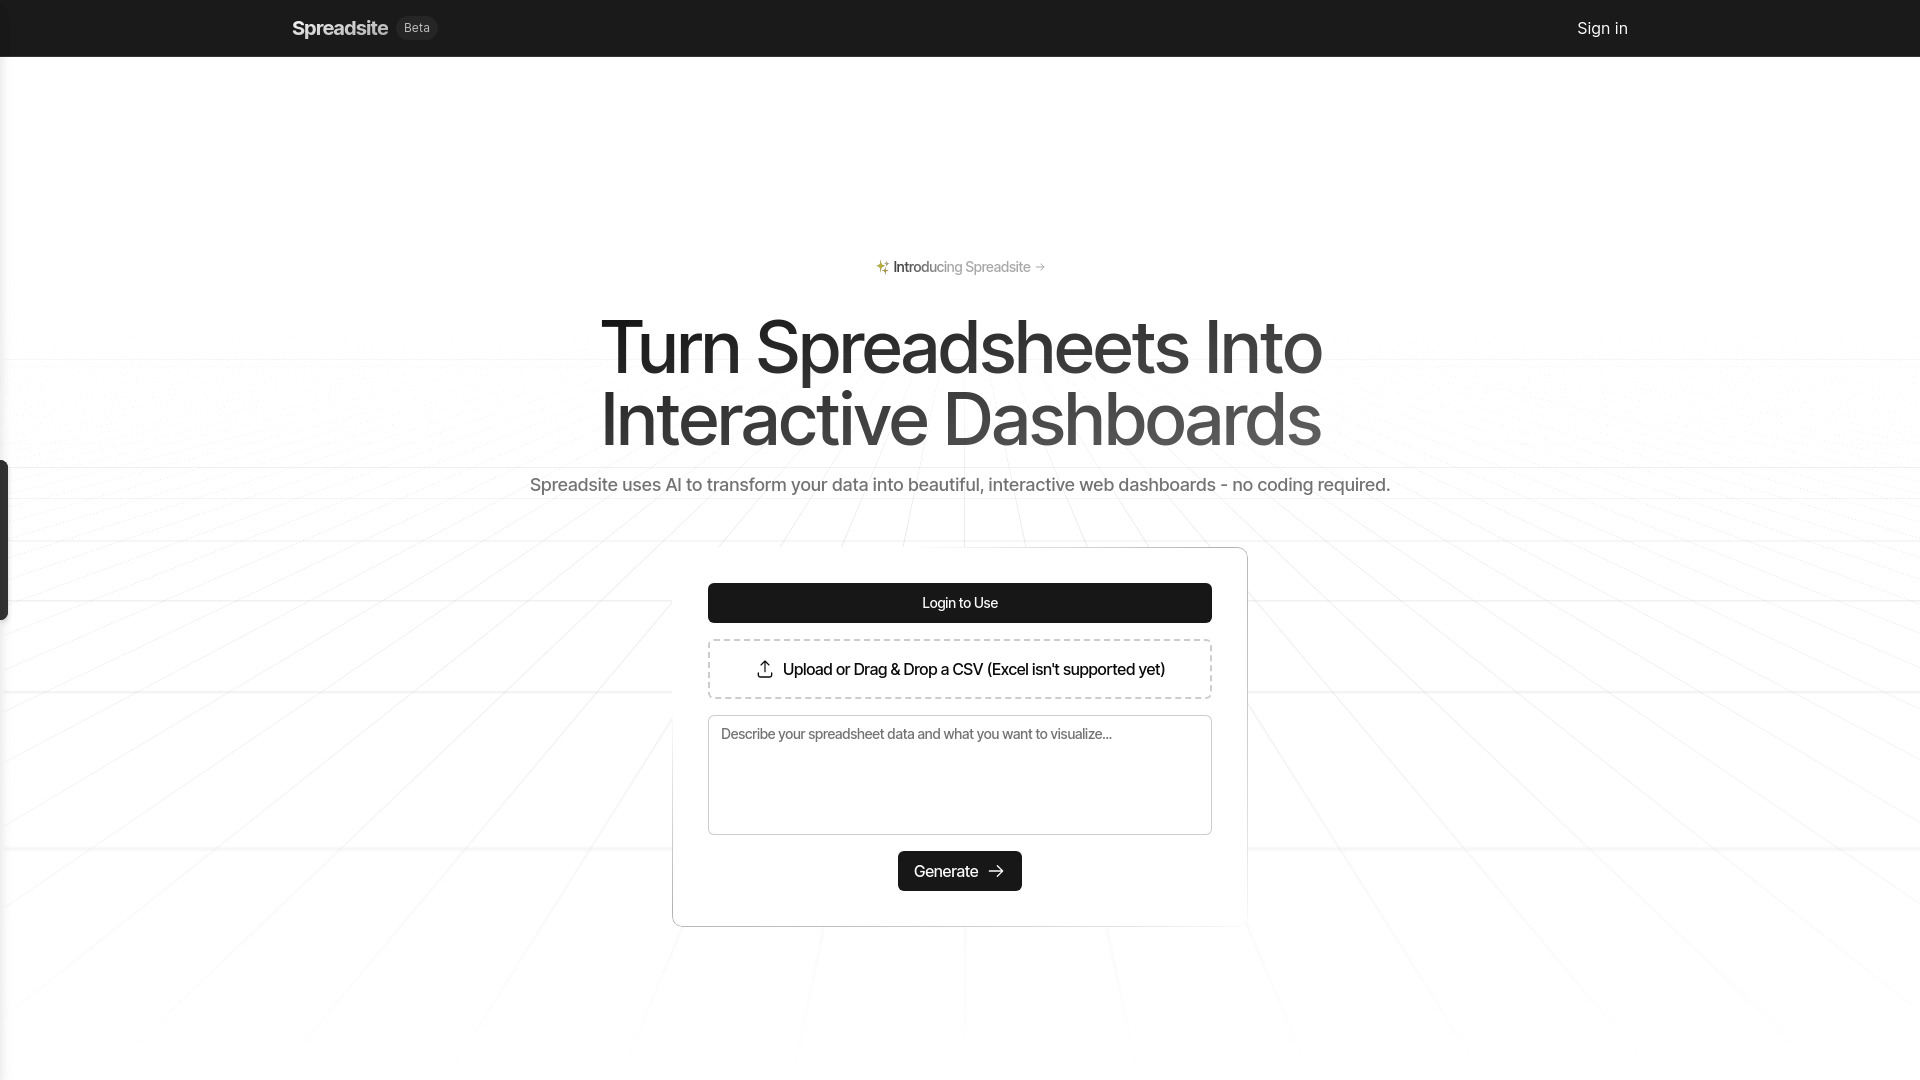
Spreadsite를 사용하는 방법은 어떻게 하나요?
The process is straightforward. Start by importing your spreadsheet data, and then leverage the intuitive drag-and-drop interface to create custom dashboards. Whether you're visualizing sales trends, tracking project progress, or analyzing market data, Spreadsite's powerful tools make it easy to craft dashboards that meet your specific needs. Simply connect to your data sources, select the desired visualization types, and arrange them on your dashboard canvas.
Spreadsite의 핵심 기능은 무엇인가요?
- 직관적인 드래그 앤 드롭 인터페이스: 코드 지식이 필요 없이 다이어그램을 쉽게 만듭니다.
- 데이터 통합: Excel, CSV, 데이터베이스 등 다양한 데이터 소스와 원활하게 연결됩니다.
- 실시간 협업: 팀과 실시간으로 작업하여 협업을 더 효율적이고 효과적으로 만듭니다.
- 사용자 정의 시각화 옵션: 다양한 차트 유형과 사용자 정의 옵션을 선택하여 데이터 이야기를 효과적으로 전달합니다.
- 반응형 디자인: 데스크톱부터 태블릿과 스마트폰까지 모든 장치에서 멋지게 보이도록 합니다.