
What is vizGPT?
vizGPT is an AI-powered data visualization tool that transforms complex datasets into stunning visual representations through natural language queries. It empowers users to create compelling charts, graphs, and infographics without technical expertise.
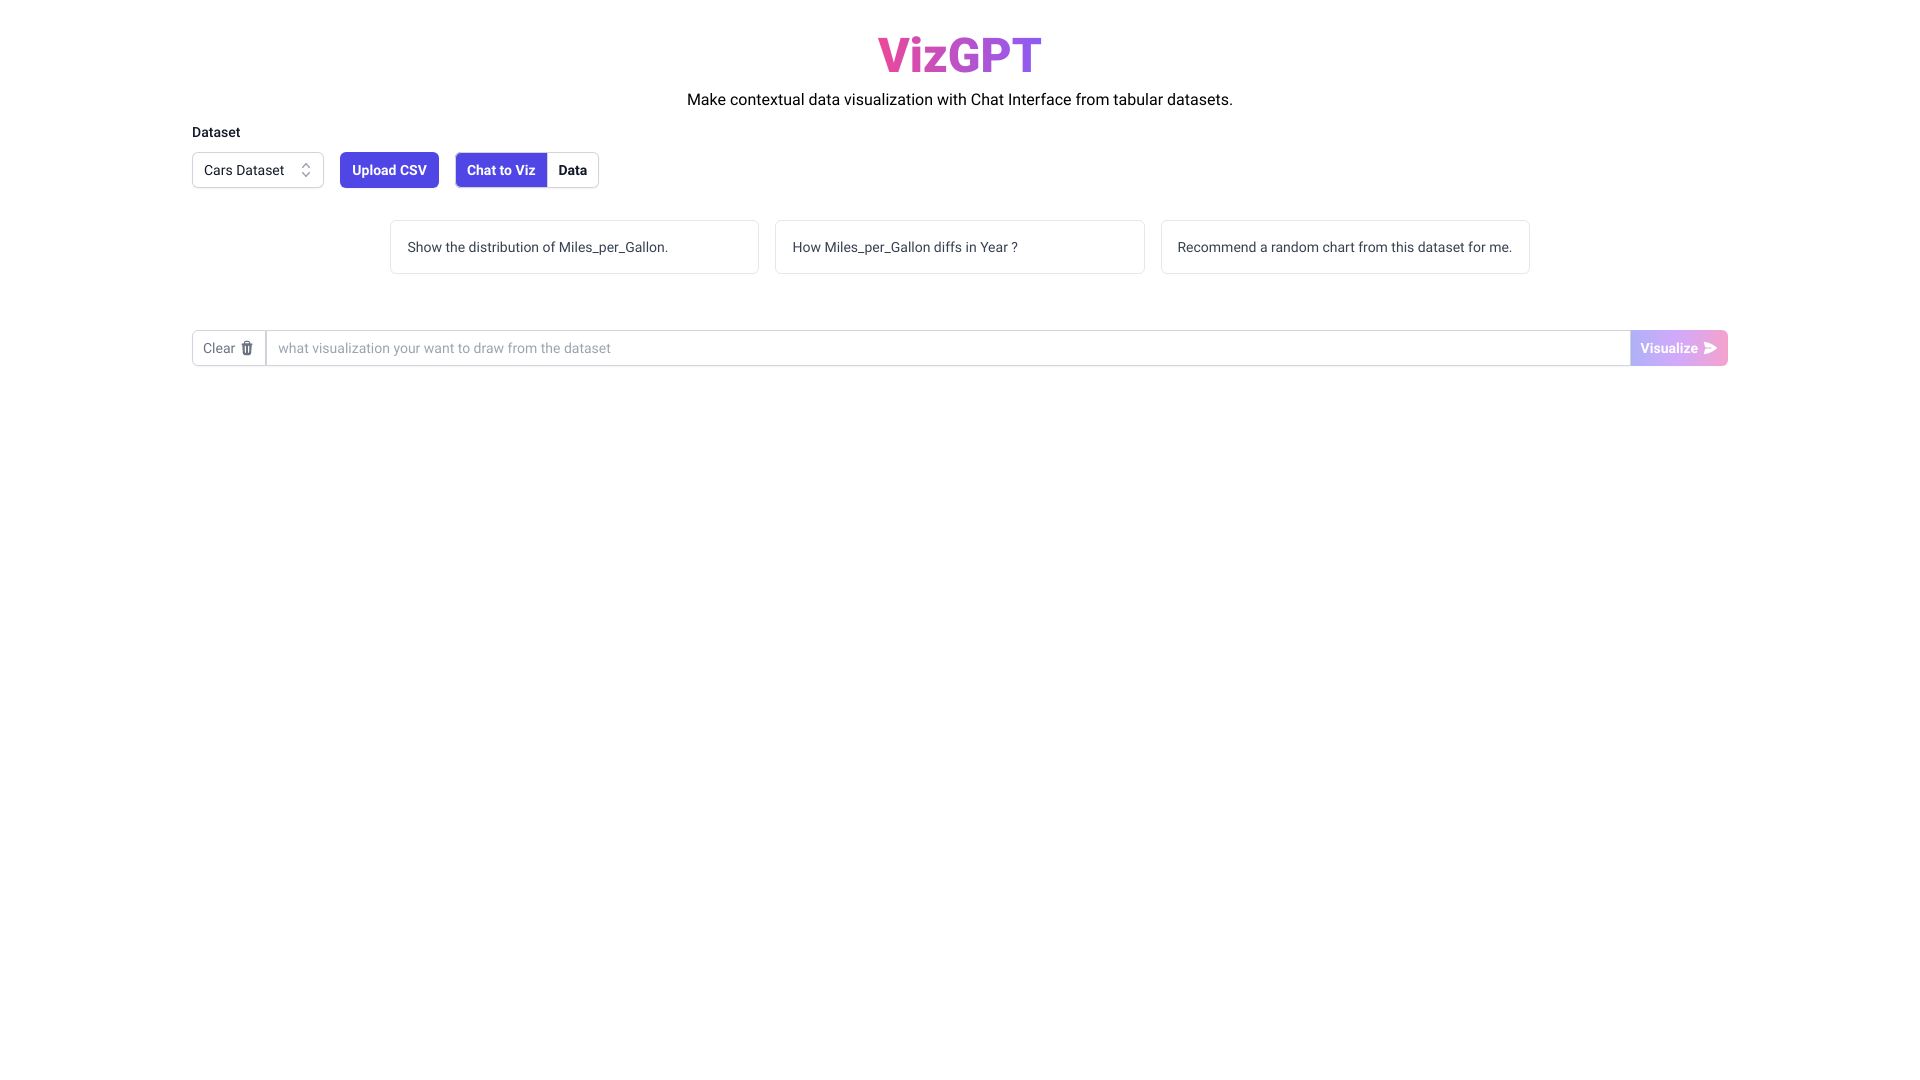
How to use vizGPT?
Simply input your data or describe what you want to visualize using natural language. The AI generates multiple visualization options. Customize colors, chart types, and layouts with intuitive controls. Export or share your finished visualizations with one click.
Core features of vizGPT?
- Natural Language Processing for intuitive query input
- Automated Data Analysis to identify patterns and insights
- Extensive Customization Options for personalized visualizations
- Seamless Integration with popular data platforms and tools
- Real-time Collaboration features for team projects