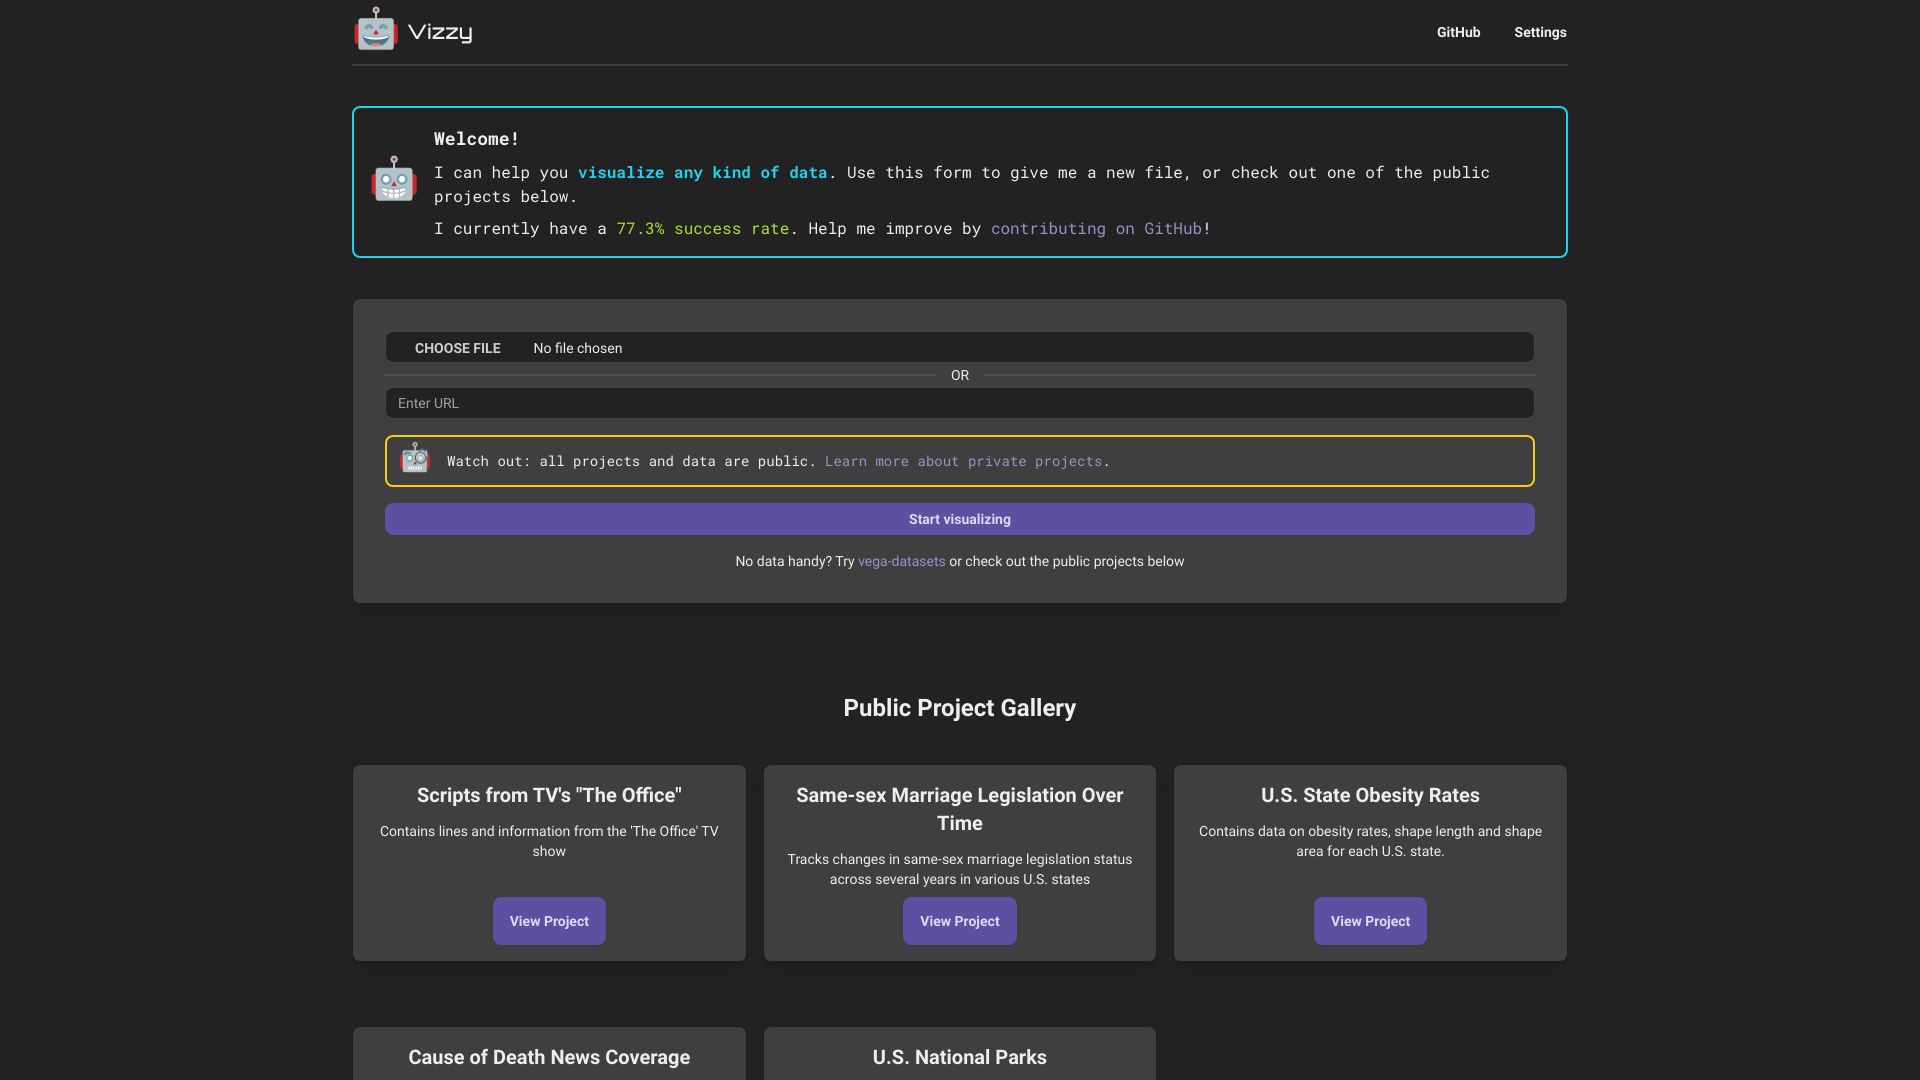
Welcome to the world of Vizzy, your go-to open-source data visualization tool. Are you tired of sifting through complex data to convey your insights? Vizzy is here to transform your data into captivating visual narratives.
What is Vizzy?
Vizzy is a powerful and user-friendly tool designed to simplify the process of data visualization. It's an open-source platform that harnesses the capabilities of ChatGPT, allowing you to quickly transform raw data into informative and engaging visualizations. Whether you're a seasoned data analyst or a business professional, Vizzy's intuitive design ensures that your data insights are communicated effectively.
How to use Vizzy?
Using Vizzy is straightforward. Start by importing your data, which can be in various formats such as CSV or Excel. Once your data is uploaded, Vizzy offers a range of charting options, including line graphs, bar charts, and pie charts. You can easily customize these charts to match your specific requirements, from color schemes to label placements. The real-time data updates feature ensures that your visualizations stay current and relevant.
Core features of Vizzy?
- Real-time Data Updates: Keep your visualizations up-to-date with live data streams.
- Customizable Templates: Choose from a variety of pre-designed templates or create your own.
- Advanced Charting Options: Select from a range of chart types and customize them to your liking.
- Intuitive Interface: Navigate Vizzy's features with ease, even if you're not a tech expert.
Are you ready to elevate your data storytelling? Try Vizzy today and transform your data into compelling visual stories. Don't let your data go unnoticed—make it Vizzy!

